
Candlestick patterns are super important for understanding stock market trends. They help us see what people are feeling about the market and where prices might go next. Knowing these patterns can really help you make smart trading choices.
Here are the 15 essential candlestick patterns you should know for stock trading, with easy-to-understand explanations and tips on how to use them.
1. Hammer Pattern

The Hammer pattern shows up after a downtrend and signals a bullish reversal. It has a small body and a long lower shadow, meaning buyers are starting to take control after sellers were in charge.
Trading Tips:
Look for a Hammer at the end of a downtrend.
Wait for a confirmation candle that’s bullish.
Buy the stock if the price goes above the Hammer’s high.
Watch this video to earn diamonds💎:
2. Doji Pattern

A Doji has the same opening and closing prices, creating a cross shape. It means the market is undecided, and a trend change might happen soon. There are different kinds of Doji patterns, like Dragonfly, Gravestone, and Long-Legged Doji.
Trading Tips:
In an uptrend, a Doji means buyers are losing power.
In a downtrend, it means sellers are getting weaker.
Wait for the next candle to confirm the trend before trading.
3. Engulfing Pattern
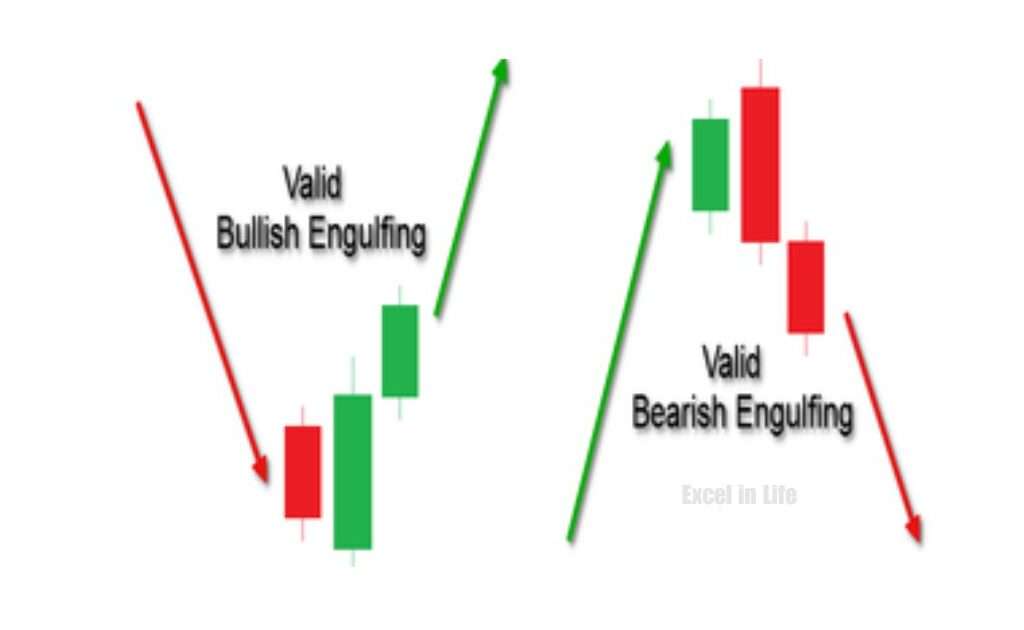
This pattern has two candlesticks. In a bullish Engulfing pattern, a small bearish candle is followed by a big bullish candle that covers the first one. This means a trend might change from down to up. A bearish Engulfing pattern is the opposite.
Trading Tips:
For a bullish Engulfing, buy when the price goes above the big candle’s high.
For a bearish Engulfing, sell when the price drops below the big candle’s low.
Use stop-loss orders to limit your risk.
4. Morning Star Pattern
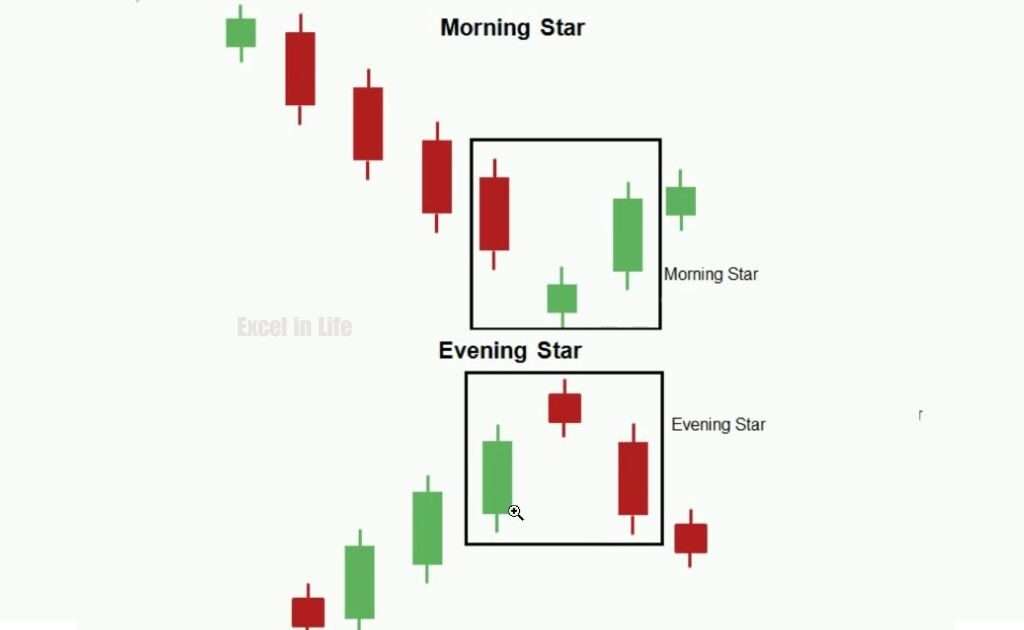
The Morning Star shows up after a downtrend and signals a bullish reversal. It has three candles: a big bearish one, a small-bodied one, and a big bullish one. This pattern means selling pressure is ending and an uptrend might start.
Trading Tips:
Identify the three parts of the Morning Star.
Buy after the third candle confirms the trend change.
Set a stop-loss below the middle candle’s low.
5. Evening Star Pattern
The Evening Star is the bearish version of the Morning Star and appears after an uptrend. It also has three candles: a big bullish one, a small-bodied one, and a big bearish one. This pattern suggests an uptrend might turn into a downtrend.
Trading Tips:
Look for the Evening Star at the end of an uptrend.
Sell after the third candle confirms the trend change.
Place a stop-loss above the middle candle’s high.
Watch this video to earn diamonds💎:
6. Shooting Star Pattern
The Shooting Star appears at the top of an uptrend and signals a bearish reversal. It has a small body and a long upper shadow, showing that buyers are losing control.
Trading Tips:
Spot the Shooting Star at the top of an uptrend.
Wait for a bearish confirmation candle.
Sell if the price drops below the Shooting Star’s low.
7. Inverted Hammer Pattern
The Inverted Hammer shows up after a downtrend and signals a bullish reversal. It has a small body and a long upper shadow, meaning buyers are starting to take over.
Trading Tips:
Look for an Inverted Hammer at the bottom of a downtrend.
Confirm with a bullish candle.
Buy when the price goes above the Inverted Hammer’s high.
8. Piercing Line Pattern
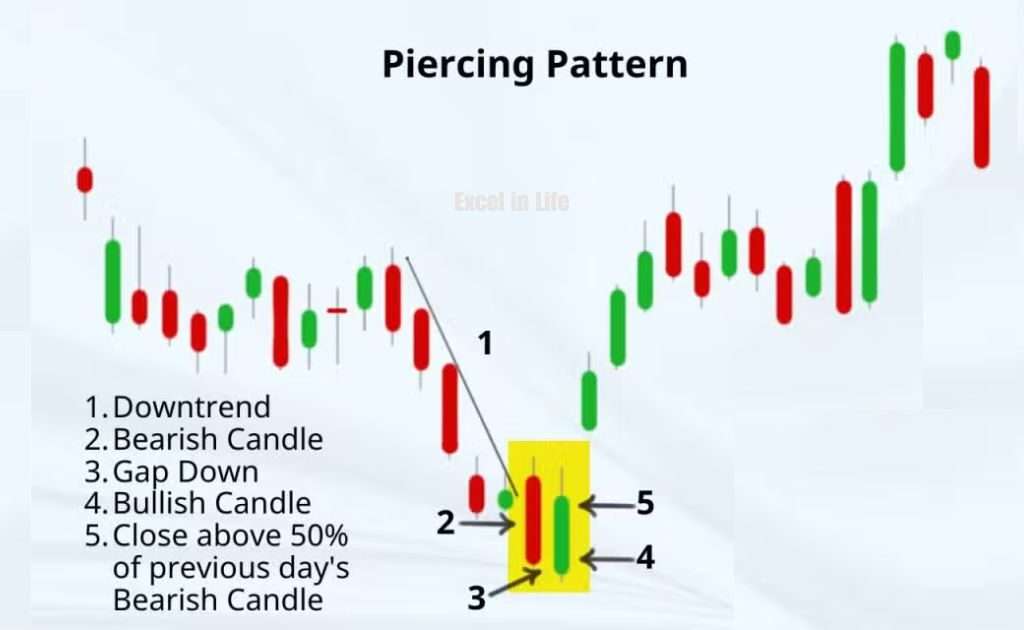
The Piercing Line is a bullish reversal pattern with two candles. The first is bearish, and the second is bullish, closing above the midpoint of the first. This means buyers are taking control.
Trading Tips:
Spot the Piercing Line during a downtrend.
Buy when the bullish candle’s high is exceeded.
Use a stop-loss below the bullish candle’s low.
9. Dark Cloud Cover Pattern
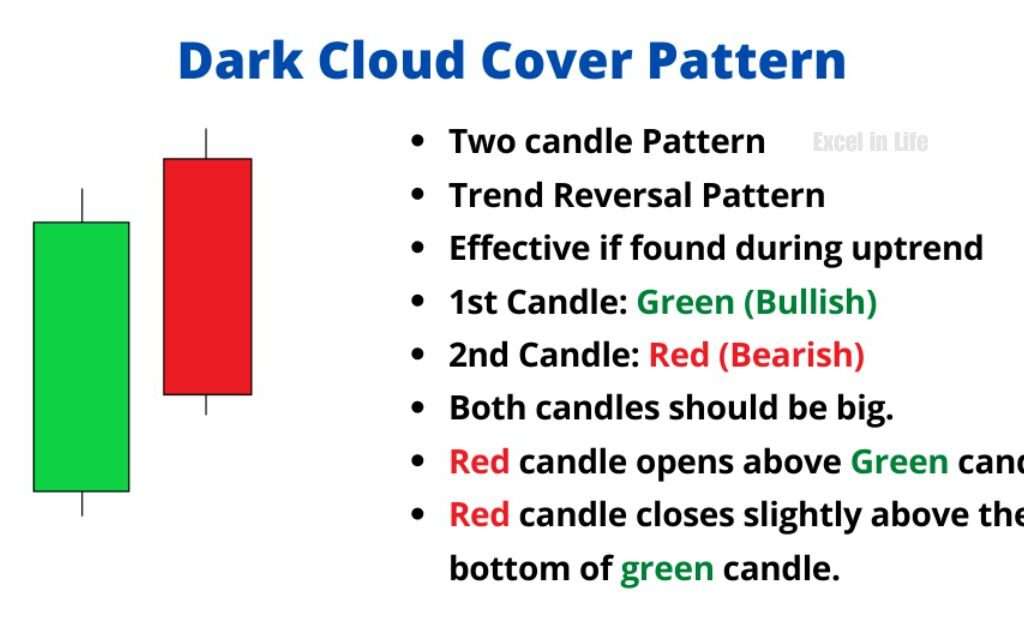
The Dark Cloud Cover is a bearish reversal pattern with two candles: a bullish one followed by a bearish one that closes below the midpoint of the first. This signals sellers are taking over.
Trading Tips:
Look for this pattern at the end of an uptrend.
Sell when the bearish candle’s low is broken.
Set a stop-loss above the bearish candle’s high.
10. Three White Soldiers Pattern

The Three White Soldiers pattern signals a bullish reversal with three consecutive bullish candles, showing strong buying pressure.
Trading Tips:
Identify this pattern during a downtrend.
Buy after the third bullish candle.
Use a stop-loss below the first candle’s low.
11. Three Black Crows Pattern
The Three Black Crows pattern signals a bearish reversal with three consecutive bearish candles, indicating strong selling pressure.
Trading Tips:
Look for this pattern at the top of an uptrend.
Sell after the third bearish candle.
Set a stop-loss above the first candle’s high.
12. Harami Pattern
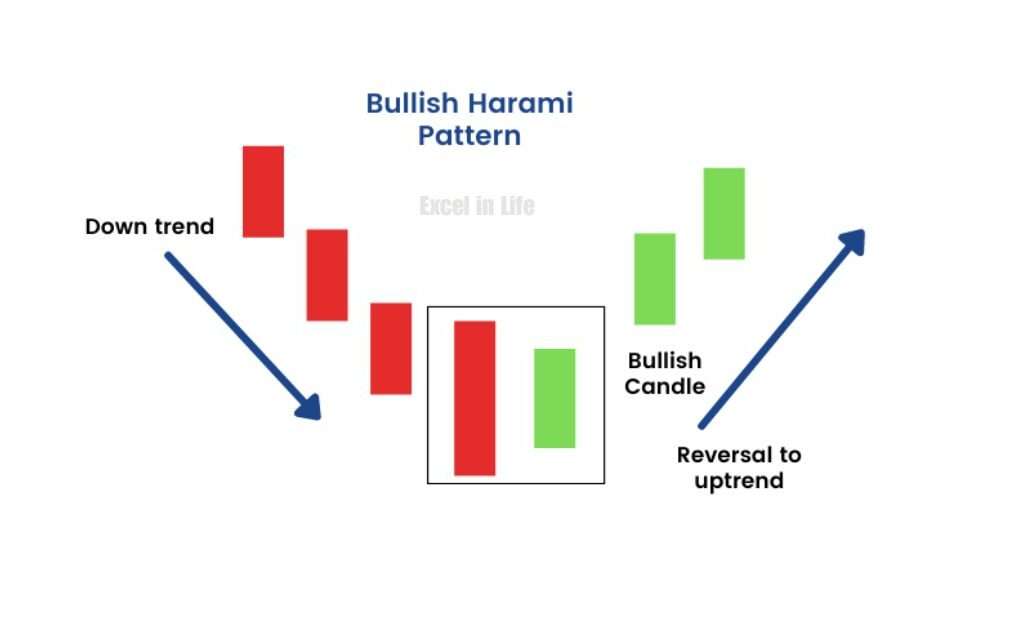
The Harami pattern has two candles. In a bullish Harami, a big bearish candle is followed by a smaller bullish one. The opposite is true for a bearish Harami.
Trading Tips:
For a bullish Harami, buy when the second candle’s high is surpassed.
For a bearish Harami, sell when the second candle’s low is broken.
Use stop-loss orders to manage risk.
13. Tweezer Tops and Bottoms Pattern
Tweezer Tops and Bottoms are two-candle patterns signaling reversals. Tweezer Tops appear at the top of an uptrend, and Tweezer Bottoms appear at the bottom of a downtrend.
Trading Tips:
For Tweezer Tops, sell when the second candle’s low is broken.
For Tweezer Bottoms, buy when the second candle’s high is surpassed.
Use stop-loss orders above or below the patterns.
14. Marubozu Pattern
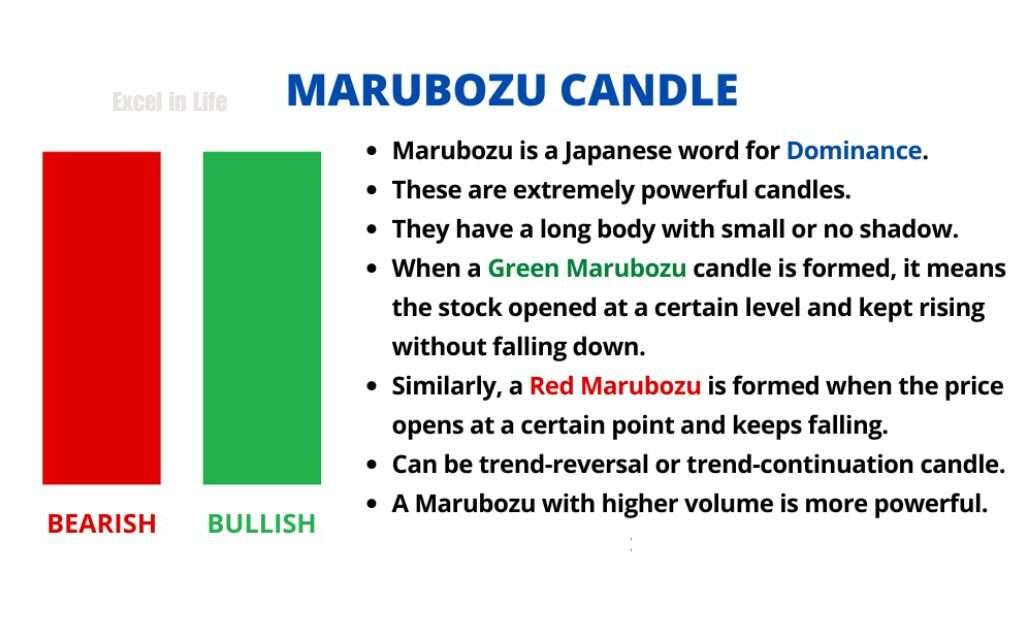
Marubozu candles have no wicks, just a full body, showing strong trends. A bullish Marubozu opens low and closes high, while a bearish one opens high and closes low.
Trading Tips:
A bullish Marubozu suggests a strong uptrend; consider buying.
A bearish Marubozu indicates a strong downtrend; consider selling.
Use trailing stop-loss orders to protect profits.
15. Spinning Top Pattern
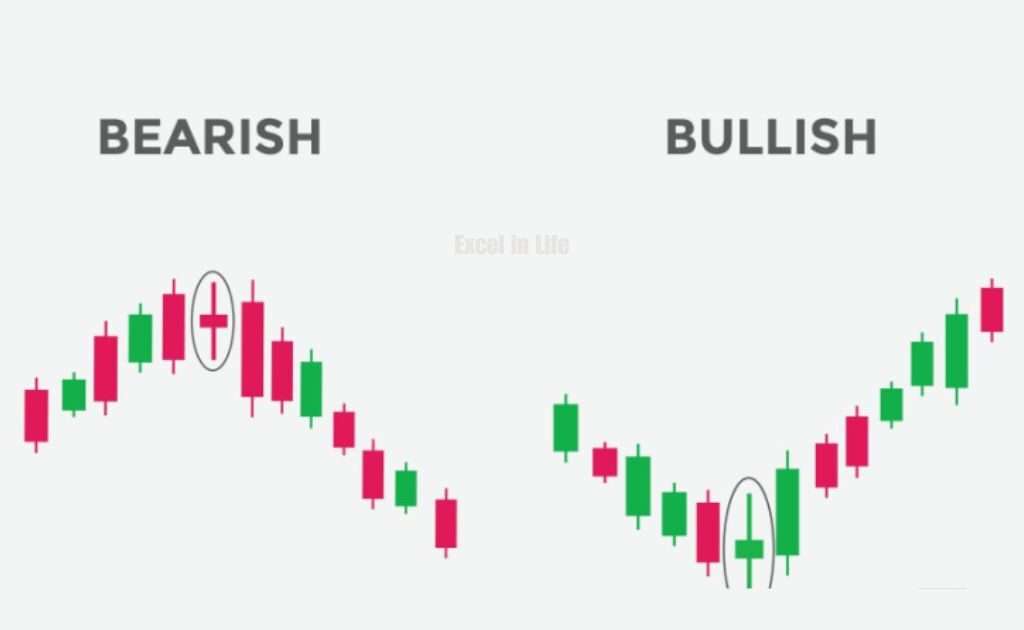
A Spinning Top has a small body with long shadows, showing market indecision.
Trading Tips:
Wait for confirmation from following candles.
Don’t trade based only on the Spinning Top.
Use other indicators to support your analysis.
Additional Insights About Candlestick Patterns
Understanding Market Context It’s important to look at candlestick patterns within the bigger picture of the market. Think about overall trends, trading volume, and other indicators to make patterns more reliable.
Volume Analysis High volume during a pattern gives it more credibility. For example, a Hammer pattern with high volume shows strong buying interest, making a bullish reversal more likely.
Combining with Other Indicators Candlestick patterns work best when combined with other tools like moving averages, RSI, and Bollinger Bands. These give extra confirmation and help filter out false signals.
Risk Management Always manage risk effectively. Use stop-loss orders to protect against unexpected market moves and don’t risk too much of your capital on one trade.
Practice and Patience Learning candlestick patterns takes practice and patience. Analyze historical
Disclaimer: This article is written for educational purposes only.
Read More: Installation and Registration of BBS Plus